apjohndim.com

Creations

Creations

Sensor System Dashboard

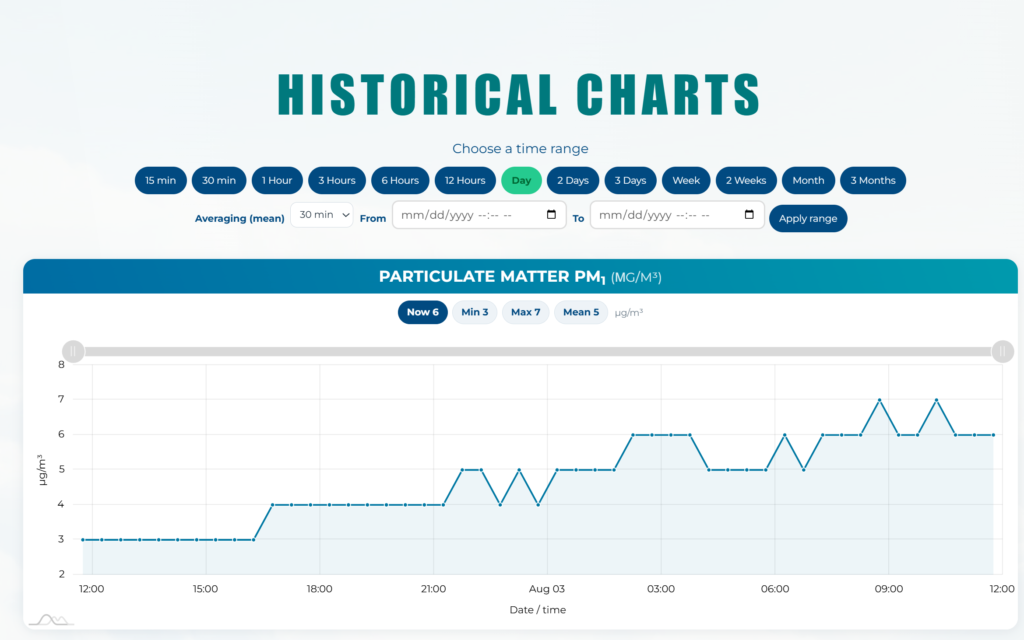
The main monitoring interface: live and historical pollutant readings, per-device time series, comparison between units, and export of the underlying data. Built so that both a researcher and a non-specialist stakeholder can read the same screen and get what they need from it. The material presented on this page is credited to the teams and institutions within which it was developed. Unless explicitly stated otherwise, this entry documents my participation in the creation of the work and does not constitute a claim of ownership; intellectual property rights are generally held by the collaborating institutes, universities or funding organisations. For clarification regarding a specific creation, please contact me.
Creations

Sensor System Studio of Experiments

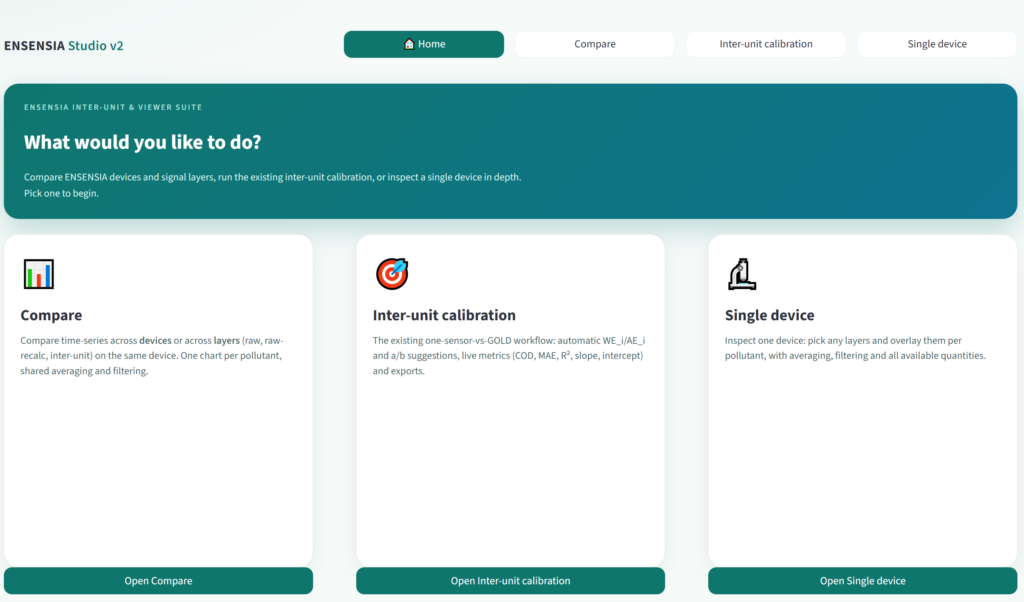
An analysis environment sitting on top of the stored data. It lets the user define experiments over selected devices and time windows, apply and compare correction or modelling approaches, and keep the results side by side — turning exploratory sensor analysis into something reproducible and traceable. The material presented on this page is credited to the teams and institutions within which it was developed. Unless explicitly stated otherwise, this entry documents my participation in the creation of the work and does not constitute a claim of ownership; intellectual property rights are generally held by the collaborating institutes, universities or funding organisations. For clarification regarding a specific creation, please contact me.
Creations

Air Quality Station Map

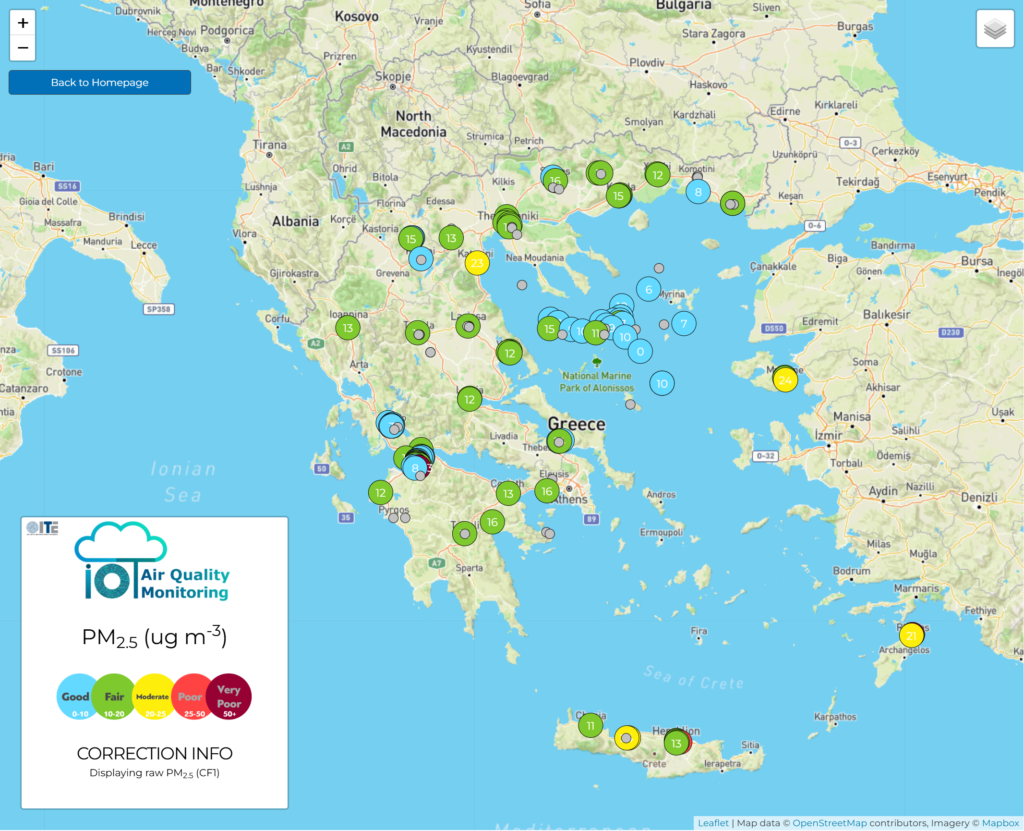
A geographic view of the monitoring network. Every station appears at its actual location with its latest status and readings, and can be opened directly for detailed inspection — the fastest way to answer “what is the network showing right now, and where”. The material presented on this page is credited to the teams and institutions within which it was developed. Unless explicitly stated otherwise, this entry documents my participation in the creation of the work and does not constitute a claim of ownership; intellectual property rights are generally held by the collaborating institutes, universities or funding organisations. For clarification regarding a specific creation, please contact me.

Creations

Air Quality Map

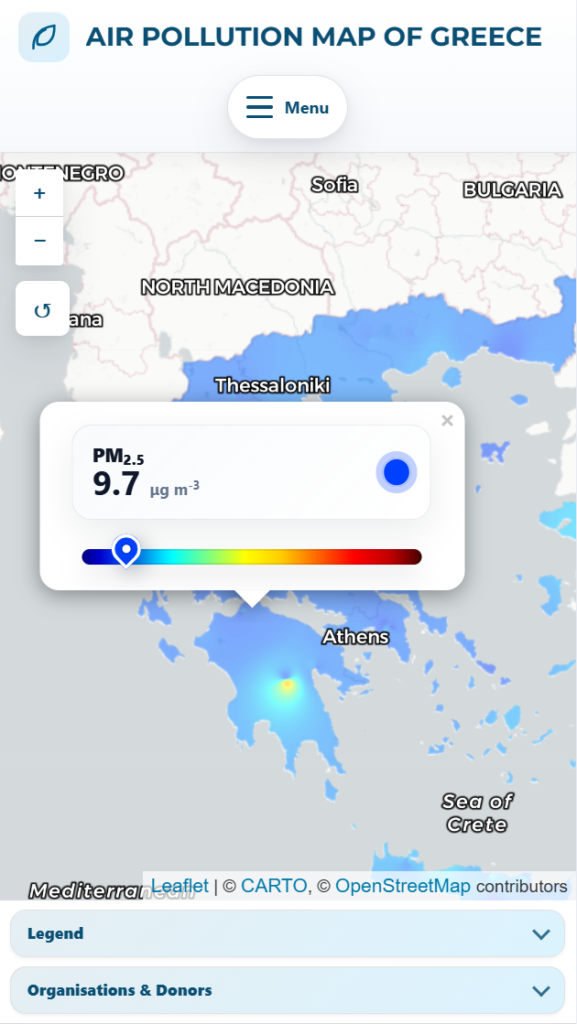
Made in the framework of the project PANSEN. A spatially continuous view of air pollution, produced by interpolating the network’s measurements into a heatmap over the covered area rather than showing isolated points. Developed in the framework of the PANSEN project (Panhellenic aerosol measurement network), with a public preview available. The material presented on this page is credited to the teams and institutions within which it was developed. Unless explicitly stated otherwise, this entry documents my participation in the creation of the work and does not constitute a claim of ownership; intellectual property rights are generally held by the collaborating institutes, universities or funding organisations. For clarification regarding a specific creation, please contact me. Preview

Scroll to Top
Name
My interests
I will use any given material for educational non-profit purposes