Article
Sensor System Dashboard
- PublishedAugust 3, 2026
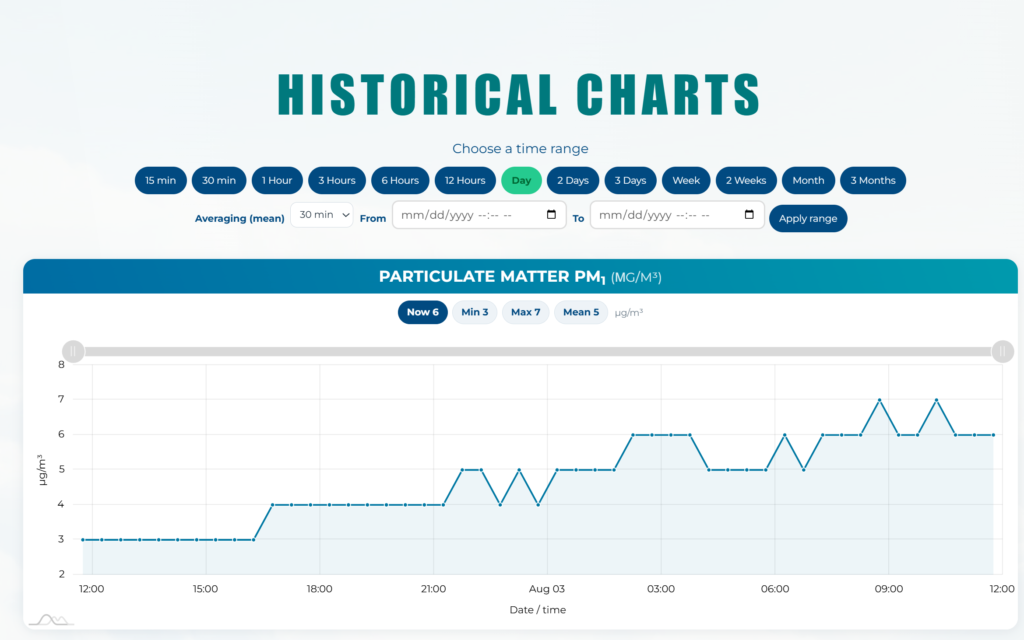
The main monitoring interface: live and historical pollutant readings, per-device time series, comparison between units, and export of the underlying data. Built so that both a researcher and a non-specialist stakeholder can read the same screen and get what they need from it.
The material presented on this page is credited to the teams and institutions within which it was developed. Unless explicitly stated otherwise, this entry documents my participation in the creation of the work and does not constitute a claim of ownership; intellectual property rights are generally held by the collaborating institutes, universities or funding organisations. For clarification regarding a specific creation, please contact me.